

Short on time?
OBI, our AI assistant, gives you the key points of this article in a few lines.
OBI answers from this article only. It can make mistakes and is not financial, tax, legal or investment advice.
A fix-and-flip book never sits still. Every active loan is a construction project, a valuation assumption, and a borrower exit plan moving at once, and each one can break independently of the other two. Underwriting is a decision you make once. Fix and flip loan portfolio monitoring is a decision you re-make every week the loan stays funded.
Most lenders and fund managers run a rigorous credit box and thin surveillance. The credit memo is tight, the draw process is a shared inbox and a spreadsheet, and the portfolio report arrives late enough to be a history lesson rather than a management tool. What follows is how to build monitoring that catches problems while they are still curable.
What Fix and Flip Loan Portfolio Monitoring Actually Means
Origination answers one question: should we make this loan at this price? Surveillance answers a different one continuously: are the collateral, the sponsor, and the exit still behaving the way we underwrote them?
Residential transition loans (RTLs) make that distinction urgent. They are short-duration, interest-only facilities, typically written for 12 to 18 months, with principal repaid when the property sells or refinances into longer-term debt.
Two consequences follow. The entire life of the loan fits inside what would be a single reporting cycle for a traditional credit fund. And repayment depends on a transaction clearing a market, not a scheduled amortization you can model.
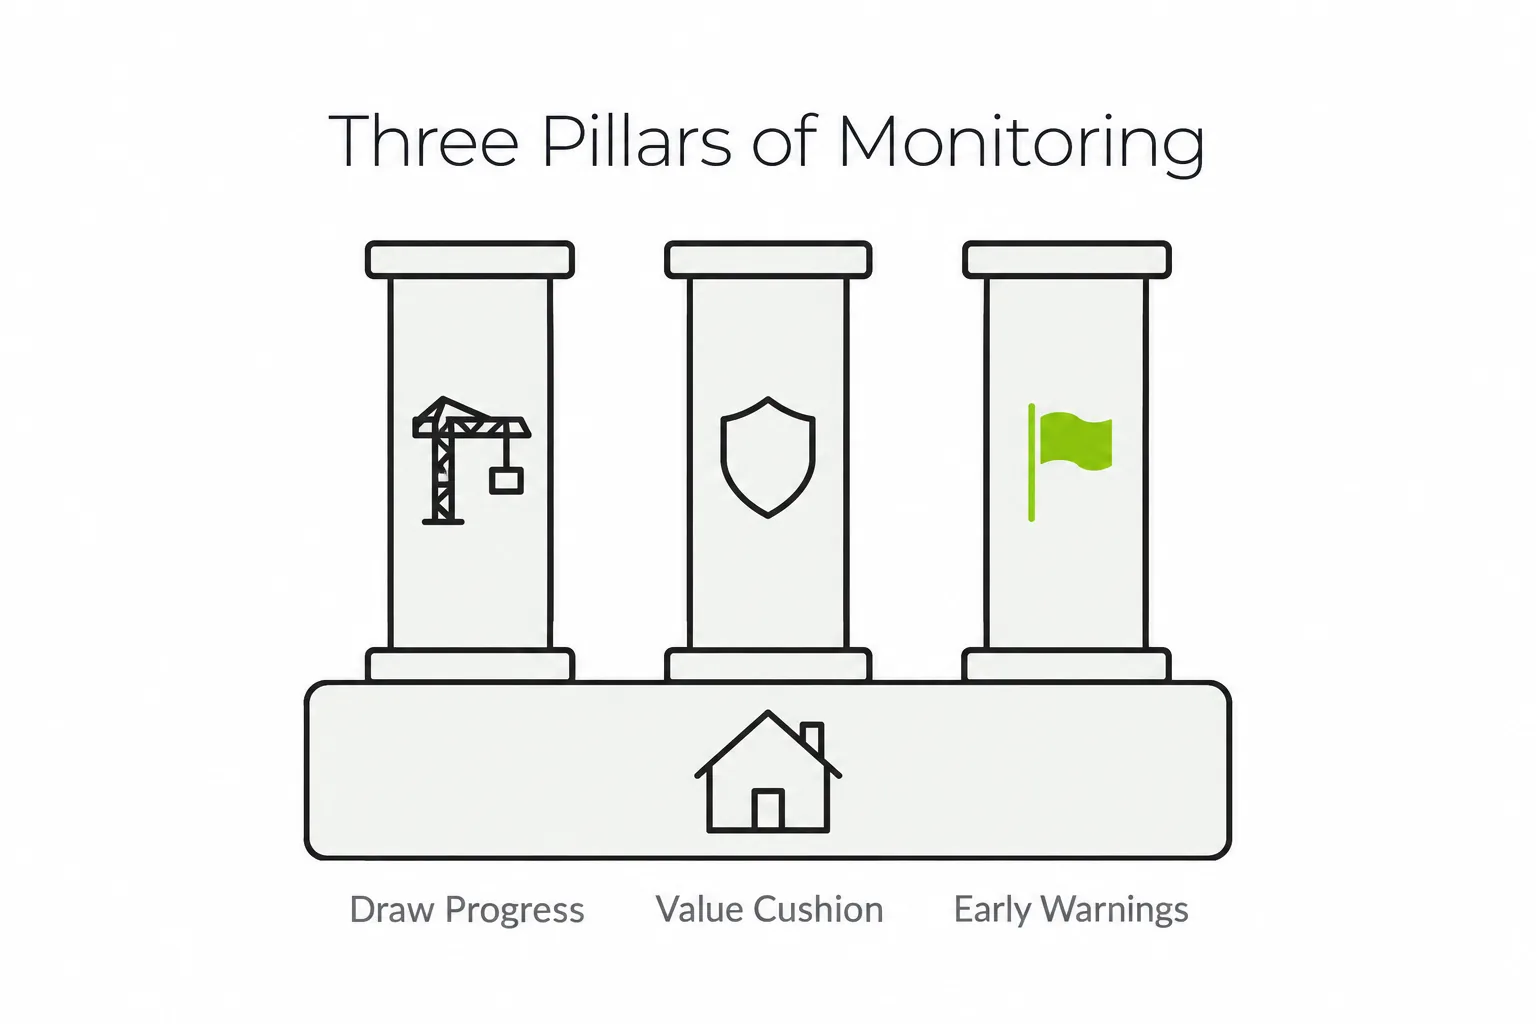
Three pillars carry fix and flip loan portfolio monitoring, and the rest of this article follows them:
- Construction draw progress: is funded capital matched by physical work in place?
- Value cushion: do loan-to-cost, loan-to-value, and loan-to-after-repair-value still leave room to absorb loss?
- Early warning triggers: what is deteriorating before it becomes a missed payoff?
The output has more consumers than people expect. Portfolio managers allocate attention with it. Credit committee sets watchlist policy. Warehouse and back-leverage lenders test the borrowing base.
Fund administrators, auditors, LPs, and boards use it for valuation and performance. When those groups read numbers built from different files, the week goes to reconciliation instead of management.
One practical threshold: past a few dozen active assets, loan-by-loan review stops working. Attention spreads evenly across loans that deserve none and loans that deserve a site visit. Exception-based monitoring surfaces only the loans breaching a defined rule, so reviewers spend time where the risk is.
Build the Data Foundation Before the Dashboard
Dashboards fail when the tape underneath cannot support the question, and fix and flip loan portfolio monitoring is only as good as that tape. Before designing any report, confirm the loan record carries the fields surveillance depends on:
- Committed versus funded amount, with the rehab holdback balance tracked separately
- Interest reserve balance and burn rate
- Original maturity, extension options and fees, and extensions already exercised
- Guarantor and sponsor identifiers, so exposure rolls up to a single credit
- Cross-collateralization and cross-default flags
A regular loan data tape review catches missing fields and stale values before they reach a report.
Property-level fields matter as much: purchase price, as-is value, budgeted rehab by line item, after-repair value (ARV), permit and entitlement status, and the current scope of work including approved change orders.
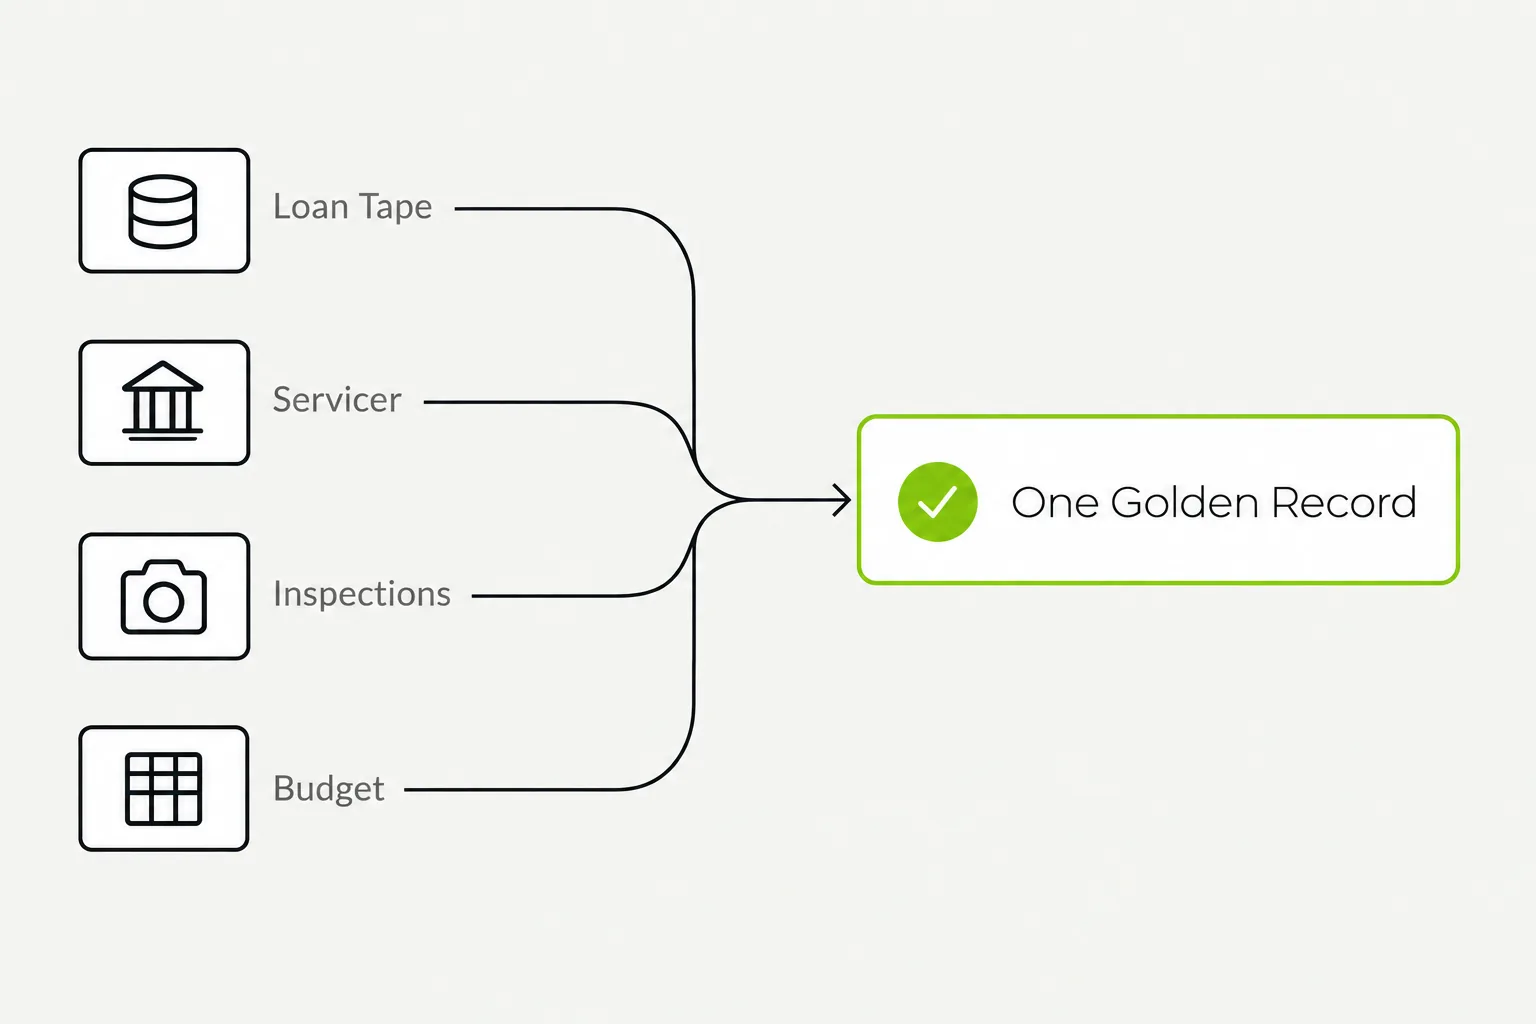
The bottleneck is rarely analytics. It is data aggregation. The loan tape sits in the origination system, cash sits with the servicer, inspections sit with a third-party vendor or in a field officer’s photo roll, and the budget sits in a spreadsheet the borrower emailed. A reliable metric means normalizing all of that into one reconciled record per loan per period.
Two disciplines make the record trustworthy. Golden-source discipline: one authoritative version per loan per reporting date, versioned, with an audit trail whenever a prior period is restated.
Time-series design: store every metric as of every reporting date instead of overwriting the current value. Snapshots show where a loan is. Trends show where it is going, and in a 12-month asset the trend is the signal.
Construction Draw Management: Where Losses Are Prevented
Strong construction loan draw administration gives every step an owner, from request validation to lien waivers to fund release.
More fix-and-flip losses are prevented in the draw process than in the credit box. The cycle runs: borrower submits a request against budget line items, the request is validated against remaining budget and prior funding, an inspection verifies work in place, lien waivers and a title update are collected, funds release, and holdback and interest reserve rebalance.
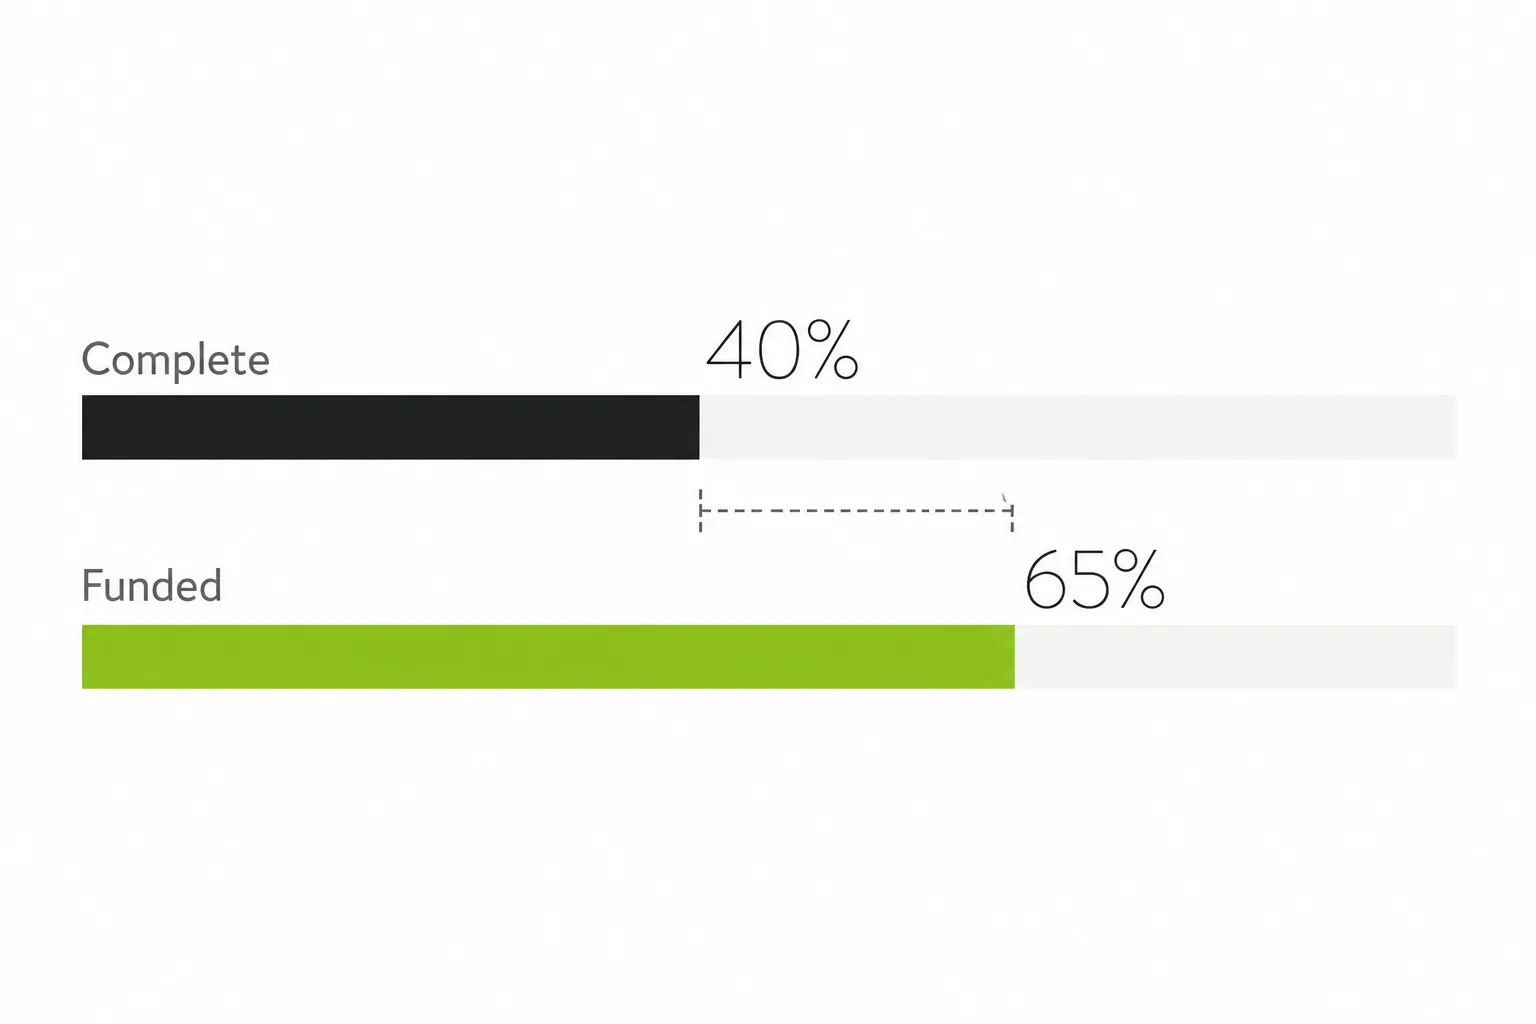
The most useful exception metric in that cycle is percent complete versus percent funded. A project 40% complete that has drawn 65% of its rehab budget is saying one of three things: the budget was wrong, the contractor is behind, or money left the project.
Any loan where funded progress runs materially ahead of physical progress belongs on a review list that day, not at month end.
Around that metric, track:
- Budget re-trades: change orders, contingency burn, and reallocation between line items. A budget quietly rewritten three times is a different deal than the one underwritten.
- Inspection integrity: internal or third-party, cadence between inspections, and retention of dated, geotagged photo evidence tied to the specific draw funded.
- Draw velocity: no draw activity for 45 to 60 days on a live rehab is a stall until proven otherwise. Nothing in a functioning project looks like silence.
| Metric | What it flags | Review rule |
|---|---|---|
| % complete vs. % funded | Bad budget, slow contractor, or money leaving the project | Review the same day when funding runs materially ahead of work |
| Budget re-trades | Change orders, contingency burn, line-item reallocation | Flag a budget rewritten multiple times |
| Inspection integrity | Stale or unverifiable progress | Dated, geotagged photos tied to each draw |
| Draw velocity | Stalled project | No draw for 45 to 60 days = stall until proven otherwise |
The Interagency Guidelines for Real Estate Lending Policies, issued jointly by the OCC, FDIC, and Federal Reserve, set the standard for multi-phase projects:
> “For loans that fund multiple phases of the same real estate project (e.g., a loan for both land development and construction of an office building), the appropriate loan-to-value limit is the limit applicable to the final phase of the project funded by the loan; however, loan disbursements should not exceed actual development or construction outlays.”
The control failures that repeat in file reviews are mundane: funding without current lien waivers, inspections stale by more than a cycle, soft costs funded ahead of the hard cost work they support, and duplicate draws against cross-collateralized assets where the same scope was funded twice. Each is cheap to catch with a rule and expensive to find in a workout.
Tracking the Value Cushion: LTC, LTV, and ARV in Motion
The leverage ratios are not static inputs from the credit memo. They move every time a draw funds and every time the submarket moves.
| Ratio | What it measures | Why it matters |
|---|---|---|
| Loan-to-cost (LTC) | Sponsor equity vs. purchase plus rehab | Shows if the borrower still has something to lose |
| Loan-to-value (LTV) | Exposure vs. current as-is value | What you could recover today, mid-renovation |
| Loan-to-ARV | Total exposure vs. projected finished value | Caps loss severity |
Loan-to-cost measures sponsor equity against purchase plus rehab, so it determines whether the borrower still has something to lose. Loan-to-value against current as-is condition tracks what you could recover today, mid-renovation, usually the worst moment to own the asset.
Loan-to-ARV is the loss-severity constraint, because it tests total exposure against the value the project is supposed to create.
Underwritten ARV has to be re-tested, not inherited. It rests on comparable sales that decay, days-on-market assumptions, and a price point that may no longer clear. Put revaluation triggers in policy:
- A scheduled comparable-sales refresh (90 days is a common cadence)
- Any listing price reduction on the subject property
- A failed or terminated sale contract
- Material movement in submarket inventory or absorption
- Any extension request, without exception
Then stress it. Model ARV haircuts at several levels combined with extended hold periods, and measure how much cushion erodes and how many loans breach policy caps in each case. One loan’s cushion is a credit question.
The distribution of cushion across the book is a portfolio question, so aggregate by vintage, MSA, sponsor, and product type. The thin tail is rarely spread evenly. It concentrates in one sponsor, one submarket, or one quarter’s originations.
Early Warning Triggers and an Escalation Ladder
| Tier | Triggers |
|---|---|
| Project | Schedule slip, draw stall, failed inspection, permit lapse or stop-work notice, mid-project contractor change |
| Borrower | Late or missed interest, tax or insurance lapse, mechanics lien, litigation, stress in the sponsor’s other loans |
| Market | Rising days on market, more list-price cuts, inventory build at the subject’s price point |
| Maturity | Exit review at 90 days out, escalate at 60, escalate again at 30 |
Treat approaching maturity as a trigger, not an event. Start the exit review 90 days out, escalate at 60, escalate again at 30. At 90 days out, a loan with no listing, no accepted offer, and no refinance application on file is a problem with a due date.
Hold a sponsor concentration view alongside the loan view. One borrower with six active projects is one credit with six ways to fail, and stress in one project usually gets funded by starving another.
Write the escalation ladder down with named owners and response times: watchlist tagging, enhanced inspection frequency, site visit by a credit officer, reserve freeze, formal demand for a revised plan, forbearance agreement, default notice. Then track cures.
Log every trigger, the action taken, the date, and the outcome. That history lets you recalibrate thresholds against realized performance instead of intuition, and it is the record an auditor or facility lender will ask to see.
Extensions, Modifications, and Workout Surveillance
When resale markets slow, extension requests become the most common outcome in an RTL book. They deserve underwriting, not administrative processing.
At every extension, capture and document verified completion percentage, a refreshed ARV with current comparables, the updated exit strategy (sale versus refinance into DSCR or rental financing), remaining interest reserve, and any rate or fee change.
An extension granted without a refreshed value is a mark rolled forward on faith.
The judgment that matters is timing issue versus disguised credit loss. A finished house priced correctly in a slow market is a timing problem. A half-finished house with an exhausted budget and a sponsor out of liquidity is a loss being deferred.
That distinction drives fair value marking, non-accrual policy, and what you tell investors, which is exactly why it should not be made informally.
Carry the mechanical items cleanly too: non-accrual status and the date it began, default interest accrual, and protective advances for taxes, insurance, securing and winterizing the property, or finishing critical work. Those advances are real exposure and belong in the loan balance, the cushion calculation, and the accounting treatment, not in a suspense account.
Track REO and note sales as a separate cohort. Blending recoveries into performing-loan statistics flatters yield and hides actual loss experience, which is the number you need most when setting the next vintage’s credit box.
Reporting Up: Back Leverage, Covenants, and Investors
If the book is levered, surveillance data has to be facility-grade. Warehouse and repurchase facilities apply eligibility criteria and concentration limits that decide what counts in the borrowing base, typically testing seasoning, leverage caps, delinquency status, and geographic or sponsor concentration. Loans that breach get excluded or haircut, and advance rates move with them.
Run eligibility testing, concentration testing, and covenant compliance off the same golden-source tape that drives internal monitoring. Two tapes means two answers, and the one you did not run is the one the facility lender will use.
Other levered structures face the same demands. See how NAV facility monitoring handles LTV, valuations, and covenants.
Pair that with a covenant compliance calendar so certificate deadlines, reporting deliverables, and test dates are tracked rather than remembered.
On the cash side, the same data supports waterfall calculations, cash flow modeling, and scenario forecasting: when interest reserves exhaust across the book, when repayment proceeds actually land under extended hold assumptions, and what that does to distributions and facility paydowns.
For investor and board reporting, metric definitions must match across the credit memo, the facility compliance certificate, and the LP letter. If “weighted average LTV” is computed three ways, every conversation becomes a reconciliation.
And every period, servicer cash, loan-level accruals, and fund-level books need to tie. Unglamorous work, and the foundation of reporting anyone will trust.
Fix and Flip Loan Portfolio Monitoring: Metrics for a Weekly Exception Report
Related readingAsset-Based Lending Operations, Built for ComplexityRead the guide →| Metric | What to show |
|---|---|
| % complete vs. % funded | Variance by loan, flagged above tolerance |
| Inspection and draw recency | Days since last inspection, days since last draw |
| Weighted average loan-to-ARV | Plus count and balance of loans above policy threshold |
| Near-maturity loans | Within 90 days, no listing or refinance application on file |
| Interest reserve runway | Months remaining |
| Watchlist migration | Additions, cures, net movement vs. prior period |
Build In-House, Outsource, or Blend
For fix and flip loan portfolio monitoring, the real comparison is not software license versus salary.
It is the fully loaded cost of the headcount required per hundred active loans, including the reviewer who checks the reviewer, against a technology-enabled middle office.
Scaling with analysts has a specific failure mode: it adds key-person risk and manual reconciliation points at the same time. The bottleneck in most monitoring operations is process design, not effort. A team working hard inside a broken workflow produces confident, incorrect numbers on schedule.
There is also a credibility argument for independent oversight. When someone other than the originator validates draw support, recalculates cushion, and runs covenant tests, the reporting carries more weight with warehouse lenders, auditors, and LPs. Same reason managers who could technically run fund administration in-house outsource it anyway.
Optionality matters too. A monitoring operation built only around fix-and-flip mechanics breaks the day a manager adds DSCR rental loans, ground-up construction, or another private credit sub-strategy with a different collateral and testing profile. Building for one product usually means rebuilding later.
Oak Branch Advisors provides middle office and loan administration services to lenders, borrowers, investment managers, and institutional investors across private credit strategies in the US and North America.
For fix and flip loan portfolio monitoring, that means data aggregation across servicers and systems, draw and collateral testing, borrowing base and covenant support, cash flow and waterfall calculations, and investor and board reporting, delivered through proprietary technology and a team that has worked the complex and esoteric versions of these structures.
The point is scale without proportional headcount, reporting that holds up, and an independent check confirming the portfolio is monitored the way the documents say it is.
A short diagnostic of your current draw and surveillance workflow usually surfaces the gaps faster than a dashboard rebuild. We are happy to walk through yours.
Allocators running [operational due diligence in private credit](operational-due-diligence-private-credit) look for exactly this: someone independent checking the numbers.
Frequently asked questions
How often should an active fix-and-flip loan be inspected?
Why does the loan-to-ARV cap matter more than the rate?
What are the earliest reliable signs a flip project will default?
How do you monitor draws when a borrower uses multiple contractors or self-performs?
What reporting will a warehouse lender typically require on an RTL book?
OBI Ask OBI about this article
Answers come only from the article above. For your own facility, request a consultation.
OBI answers from this article only. It can make mistakes and is not financial, tax, legal or investment advice.
Keep reading
All articles →



The team behind these articles
Reviewed by people who run private credit operations
Every article on this blog is researched, reviewed and edited by the Oak Branch team before it is published: senior professionals across private credit, asset-based lending, structured finance, operations and technology.
- Reviewed for accuracy by senior practitioners
- Figures linked to their published sources
- Written for the people who run facilities day to day
About Oak Branch Advisors
Technology-enabled middle office support, loan administration and portfolio surveillance for private credit funds, lenders and borrowers, powered by our PCS/1 platform.